Scatter diagrams are used to find a relation between two parameters. Here we need change the one parameter & get readings for other parameters.
Example:-
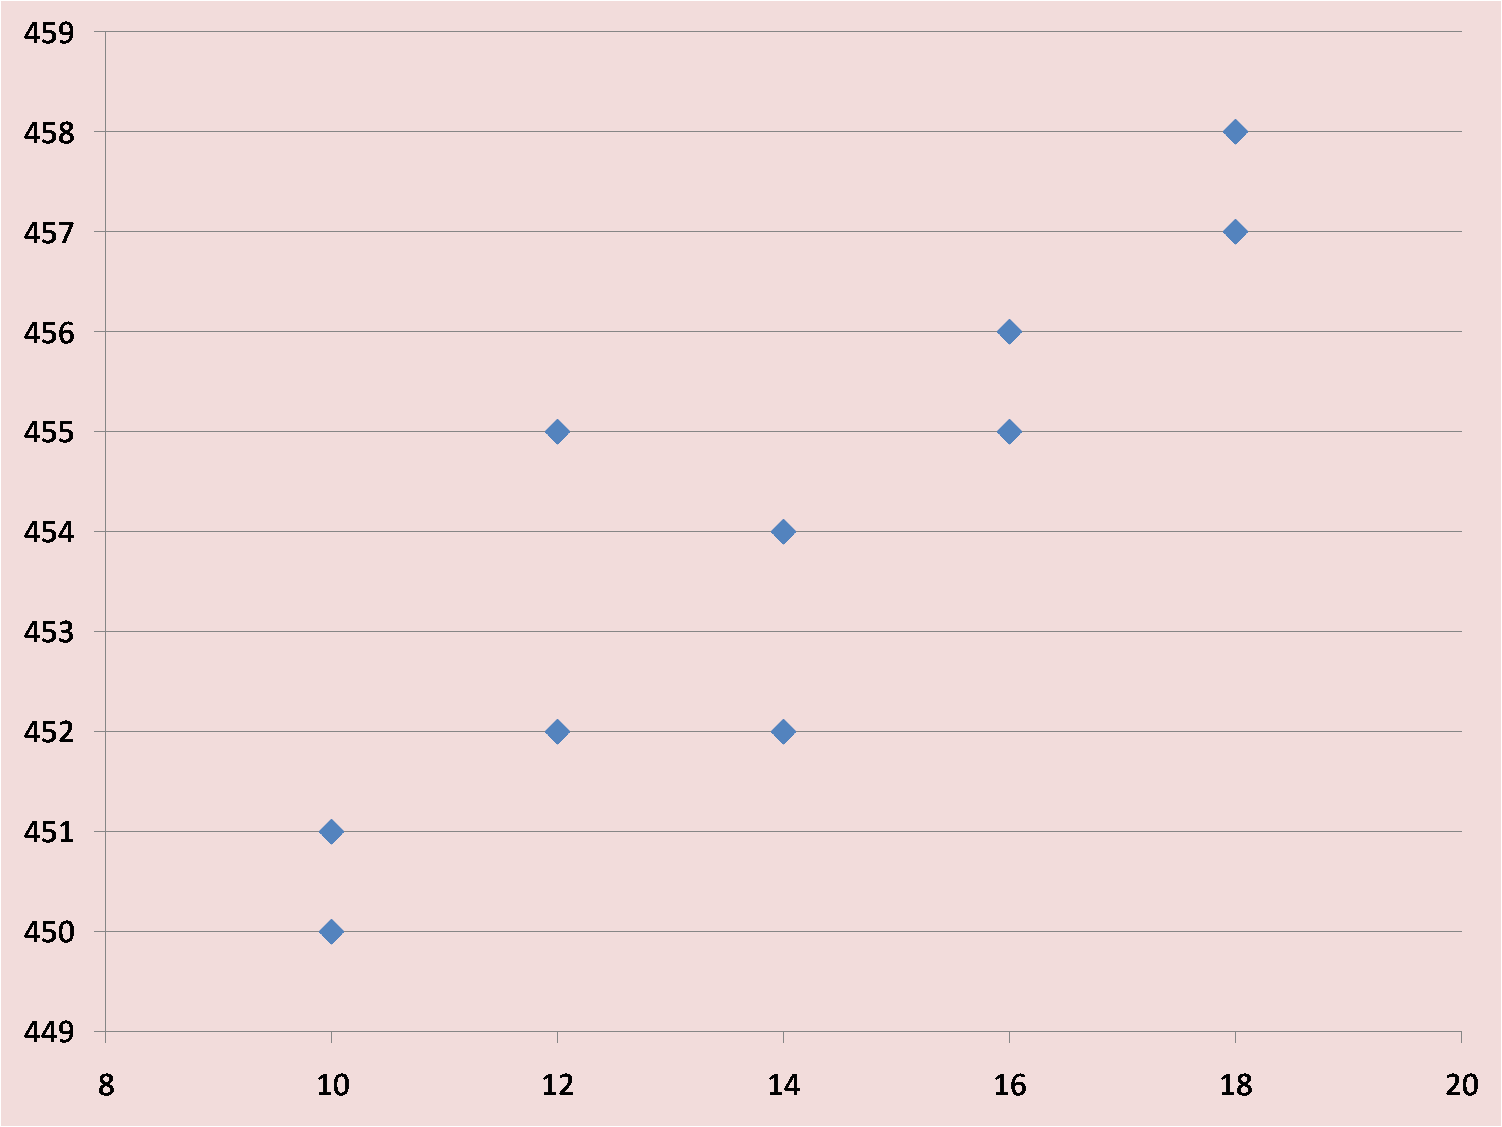
Let us take we need to find the relation between machine speed & filled volume of water for a water bottling machine. Here changing parameter is speed.
Step 01 :- Set machine speed 10bottles/min
Step 02 :- Take few samples from output & measure the volume
Step 03 :- Increase machine speed by 2 bottles/min
Step 04 :- Take few samples from output measure the volume
Step 05 :- Do step 03 & 04 till as you required.
Then plot a graph using collected data. Based on that chart it is easy to identify relationship between machine speed & filled volume.
There is 3 major types of Scatter Diagrams.
1.Positive Scatter Diagrams
2.Negative Scatter Diagrams

Like as above here increasing of the speed decreased the filled volume.
3.Scatter Diagrams Which Haven't any Relation

Here we cant find any relation between two factors.